


Dashboard
Overview
The Dashboard page in the Safe Zone plugin is designed to provide users with a comprehensive overview of their site’s security status. This page consolidates key security metrics and activities, allowing users to quickly analyze and respond to potential threats. The Dashboard includes detailed reports and visual analytics, and offers quick access to essential settings.
Purpose of the Dashboard
The Dashboard serves to:
- Provide Quick Insights: Display key security data and metrics for easy analysis.
- Monitor Security Activities: Track various security-related activities such as blocked actions, spam, and malicious attempts.
- Facilitate Quick Actions: Allow users to quickly toggle essential security features on or off.
How It Works
Key Data and Metrics
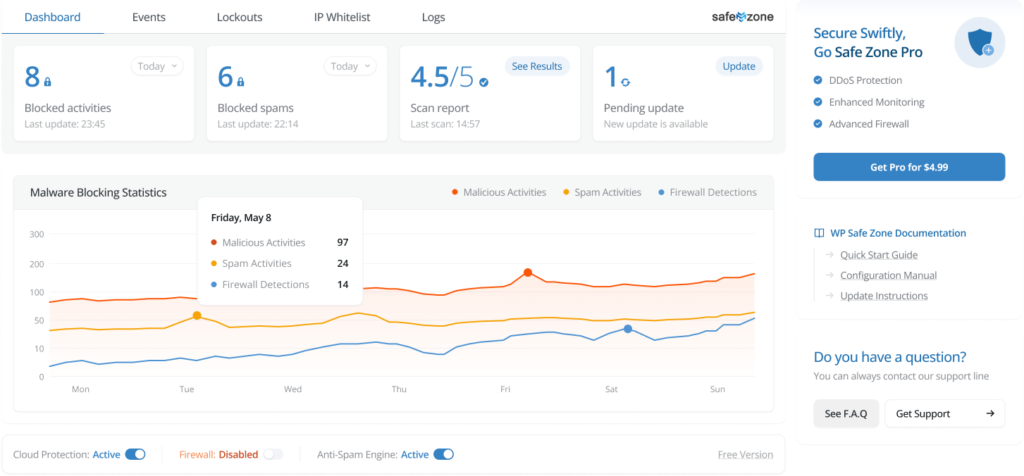
The Dashboard presents a variety of security data and metrics, both numerically and in analytical charts, to give users a clear and immediate understanding of their site’s security status. The main sections include:
Blocked Activities
- Displays the number of activities that have been blocked by the Safe Zone plugin.
- Helps users understand the volume and types of threats being prevented.
Blocked Spams
- Shows the count of spam activities that have been blocked.
- Provides insights into the effectiveness of the anti-spam measures.
Scan Report
- Summarizes the results of the latest malware and vulnerability scans.
- Highlights any issues found and actions taken or recommended.
Updates
- Lists recent updates to WordPress core, themes and plugins.
- Ensures users are aware of the latest improvements and security patches.
Malicious Activities
- Reports on detected malicious activities and attempts to compromise the site.
- Includes details on the type and frequency of these activities.
Spam Activities
- Tracks and reports on spam-related activities detected on the site.
- Helps users gauge the impact and success of anti-spam measures.
Firewall Activities
- Provides data on firewall activities, including blocked IPs and prevented attacks.
- Offers insights into the performance and efficacy of the firewall settings.
Visual Analytics
- The Dashboard includes analytical charts and graphs to visually represent the security data.
- These visualizations help users quickly identify trends and patterns in security activities.
- Interactive elements allow users to drill down into specific data points for more detailed analysis.
Quick Settings Bar
At the bottom of the Dashboard, a settings bar allows for quick access and control of key features:
- Cloud Protection (API Connection)
- Enables or disables the connection to Safe Zone servers for real-time data and updates.
- Ensures that the latest security information is always in use.
- Firewall
- Provides a quick toggle to turn the Firewall on or off.
- Allows users to quickly react to immediate security needs.
- Anti Spam
- Enables or disables the anti-spam features.
- Helps manage spam activities efficiently with a single click.
Best Practices
- Regular Monitoring: Frequently check the Dashboard to stay informed about your site’s security status.
- Review Reports: Regularly review scan reports and activity logs to identify and address any issues promptly.
- Utilize Quick Settings: Use the quick settings bar to swiftly enable or disable essential features as needed.
- Keep Updated: Ensure that the Safe Zone plugin and its features are always up-to-date to benefit from the latest security enhancements.
Conclusion
The Dashboard page in the Safe Zone plugin is an essential tool for maintaining the security of your WordPress site. By providing a consolidated view of key security metrics and activities, along with easy-to-use analytical tools and quick settings, the Dashboard enables users to effectively monitor and manage their site’s security. Regular use of the Dashboard ensures that your site remains protected against a wide range of threats.
